Advocacy & Policy
The tools below explore policies that affect the health of individuals in our community. Federal, state, and local laws all play a role in improving Black maternal and infant outcomes in St. Louis. Indicators are disaggregated by geography in order to compare St. Louis rates to Missouri rates to United States rates. Many of these data sources do not disaggregate data by race. Therefore, statistics are reflective of all populations. FLOURISH hopes data becomes more readily disaggregated by race for future updates. If disaggregation by race is possible, colors will be used. If there is an X shown instead of a rate, that means the data are not available at that level. These are opportunities to explore new data collection methods and sources.
Advocacy & Policy
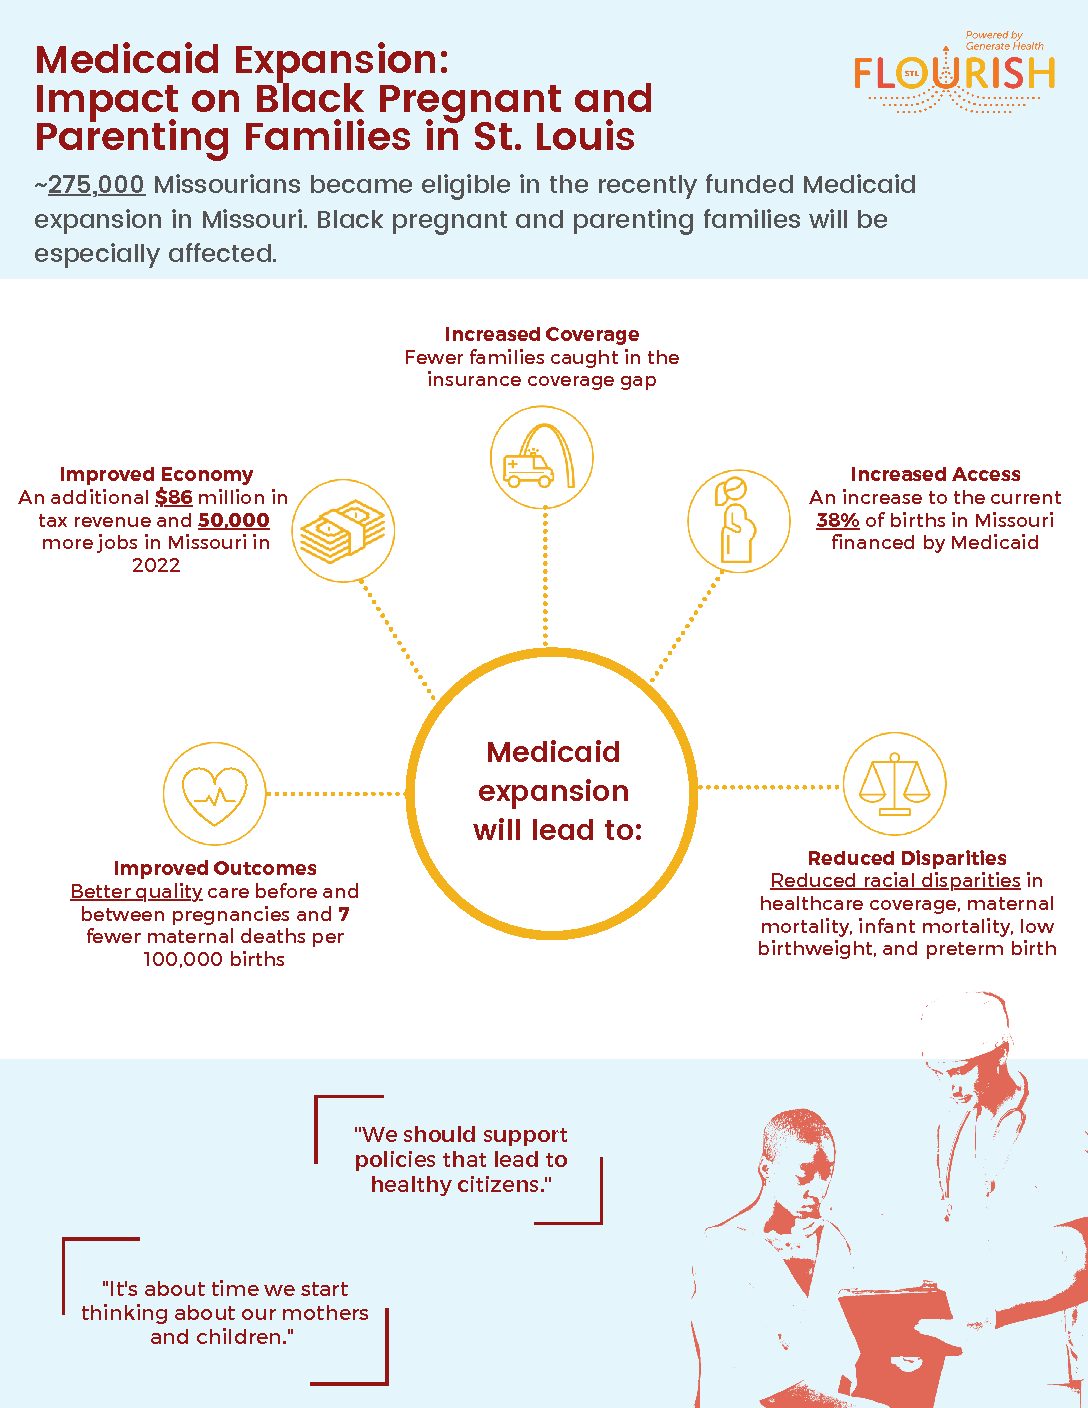
Medicaid Expansion
Medicaid expansion funding and implementation is a critical step in increasing the number of individuals with insurance coverage and thus lessening racial disparities in maternal and infant health. Medicaid expansion ensures that low-income Black pregnant and parenting families get the care they need, when they need it.
Additional Resources
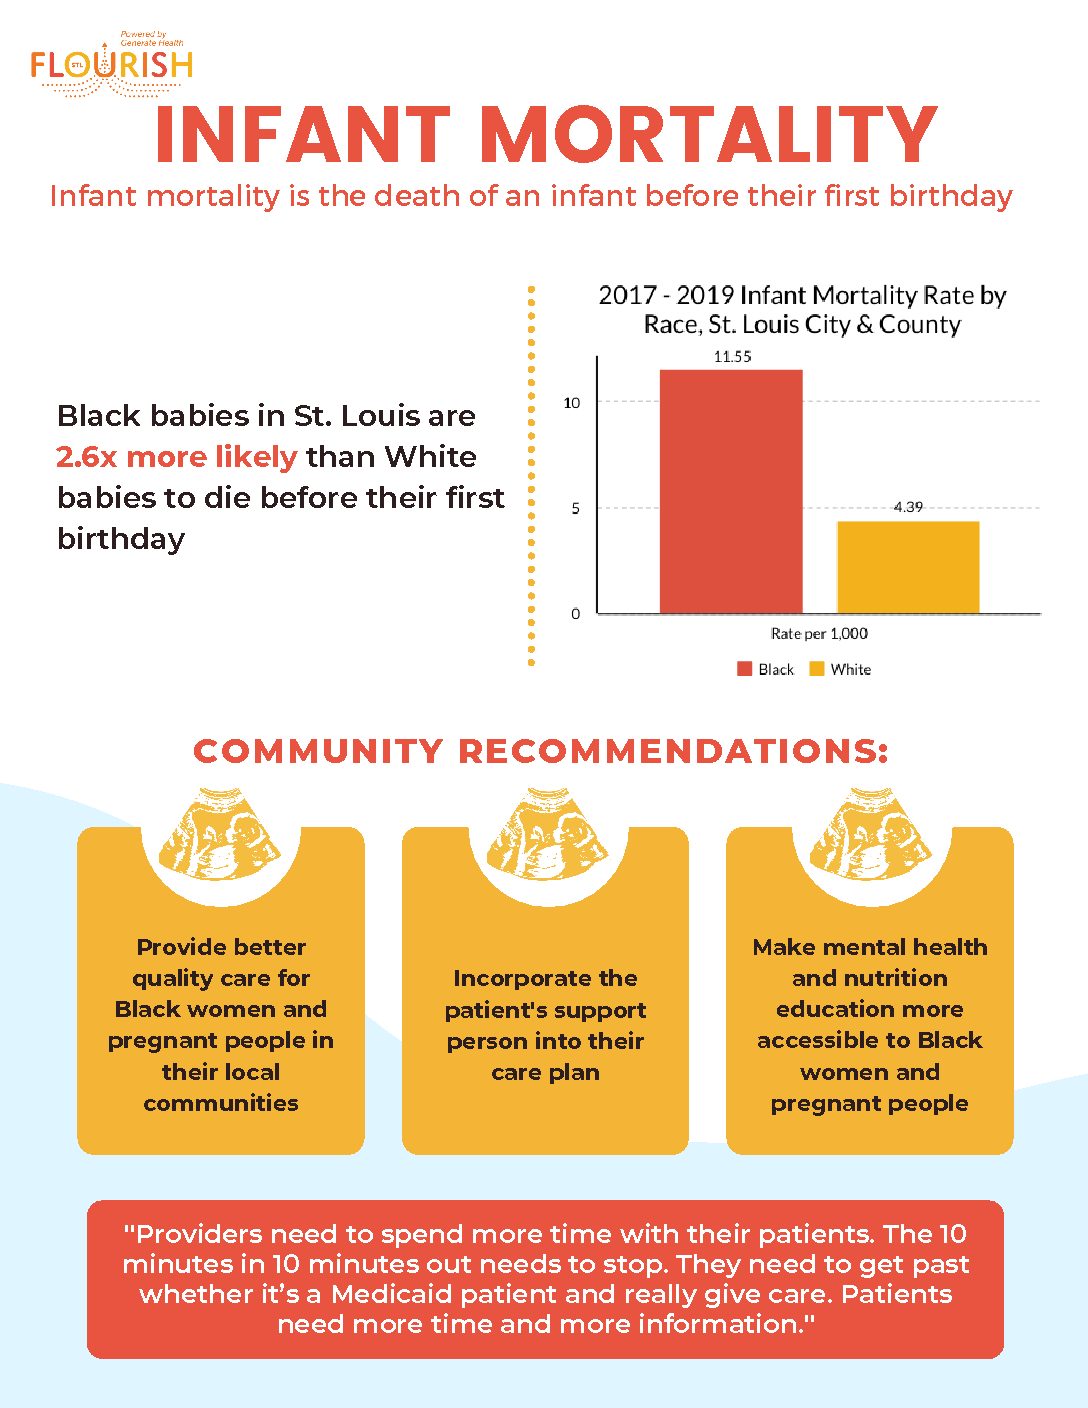
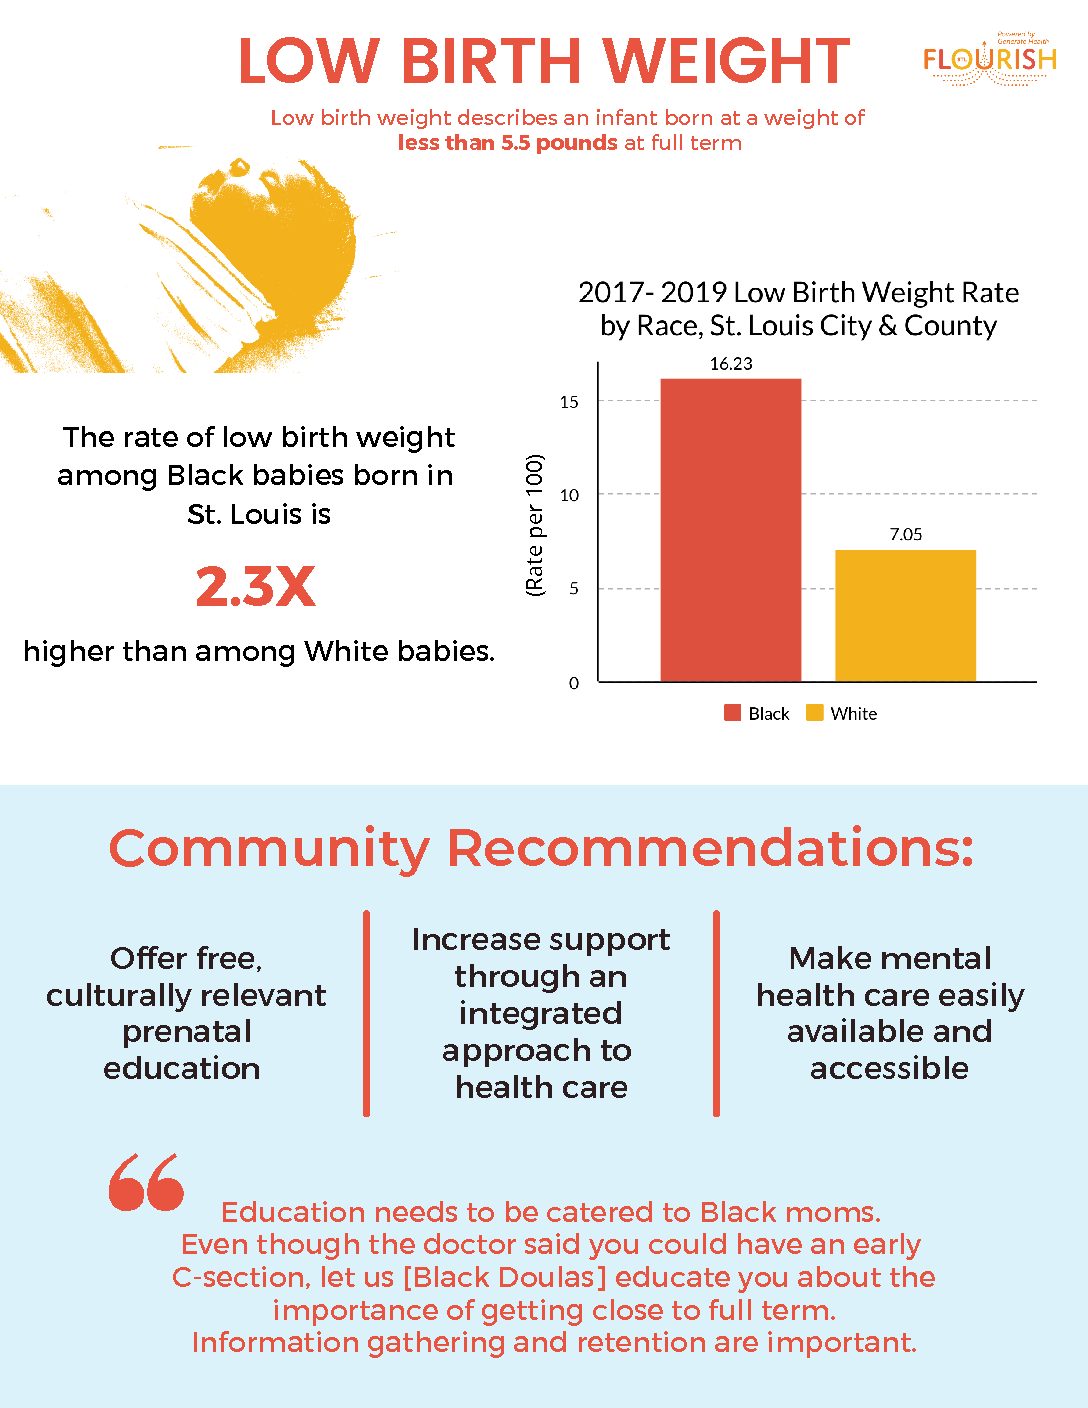
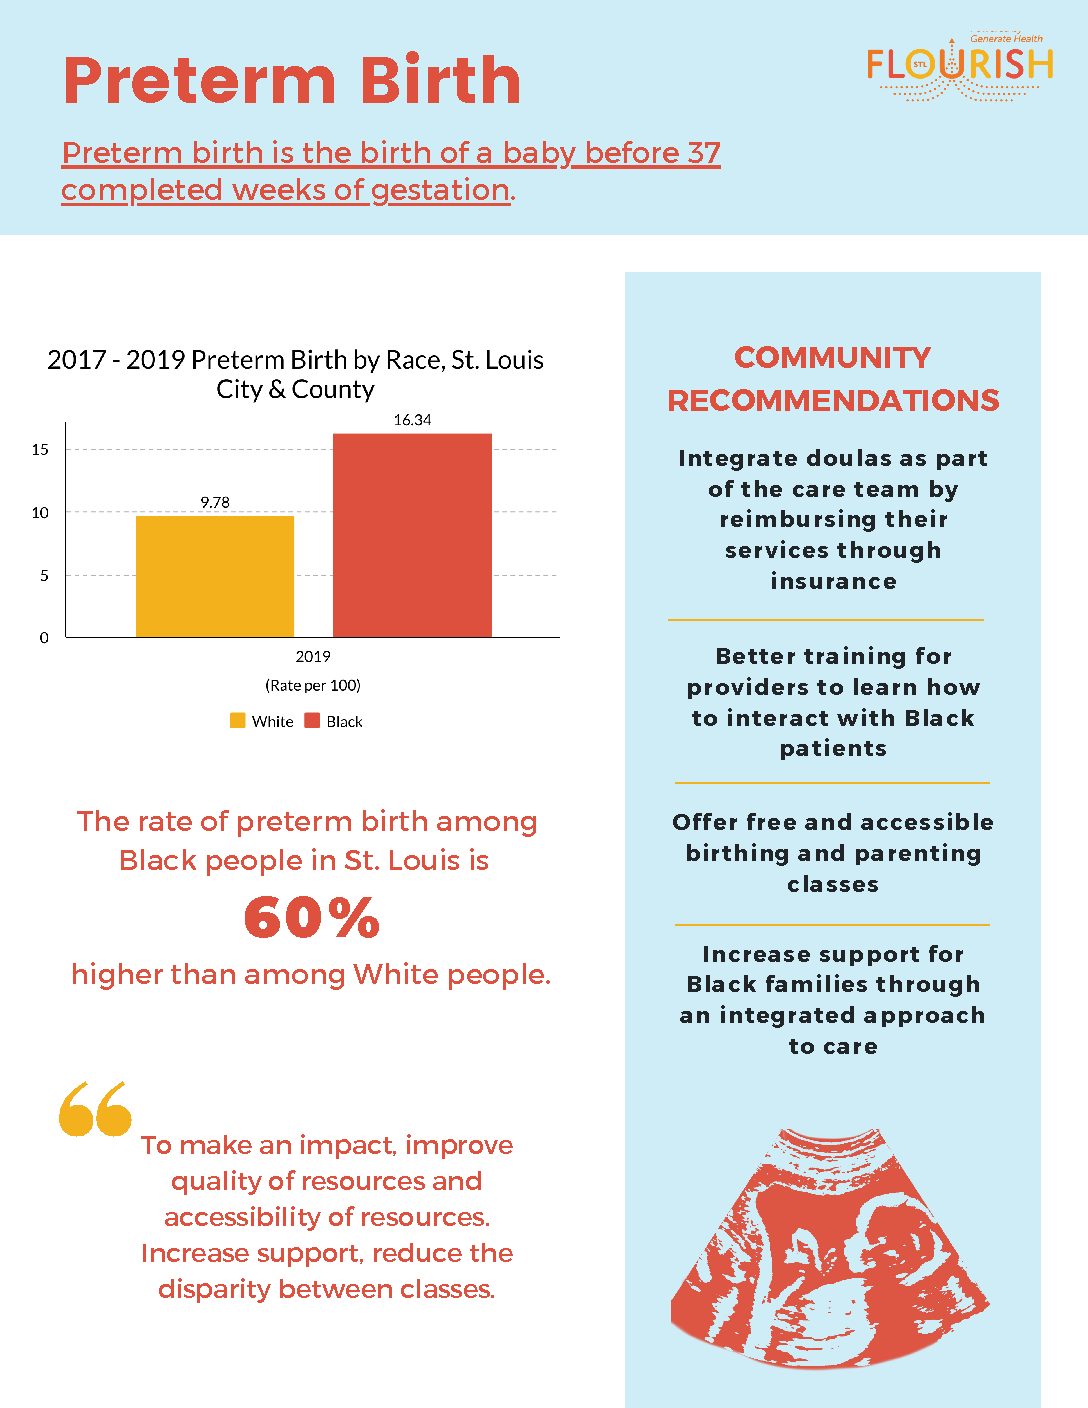
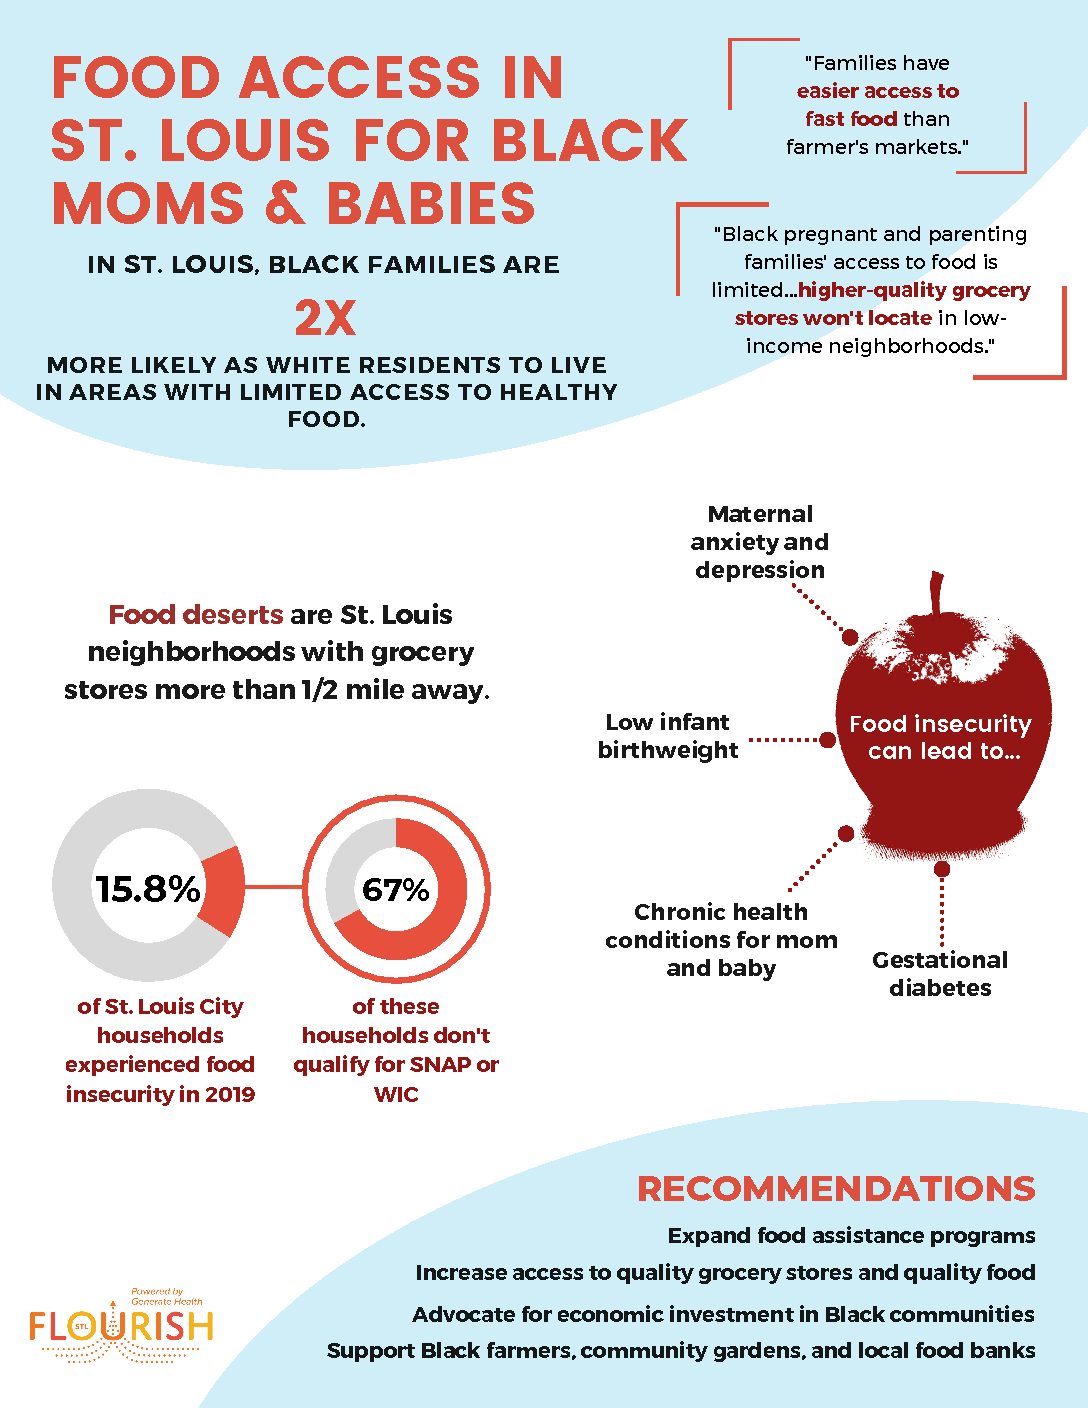
Click Red Button to View Infographic
Double-Click Red Button to Download Infographic
Health Insurance Coverage Status
Health insurance coverage status is defined as the percentage of individuals with no health insurance under 65 years old.(Source: Census)
9.3
11.9
10.8
Medicaid Eligibility
Medicaid eligibility is defined as the monthly average of new Medicaid and Children’s Health Insurance Program (CHIP) applications determined eligible for enrollment. (Source: Data.Medicaid.gov)
XX
7,114
26,384
Medicaid Enrollment
Medicaid enrollment is defined as the total number of individuals enrolled in Medicaid and CHIP. (Source: MO Healthnet Enrollment Tracker; Data.Medicaid.gov)
242,929
1,248,389
82,761,078
Policy & Advocacy
Postpartum Coverage
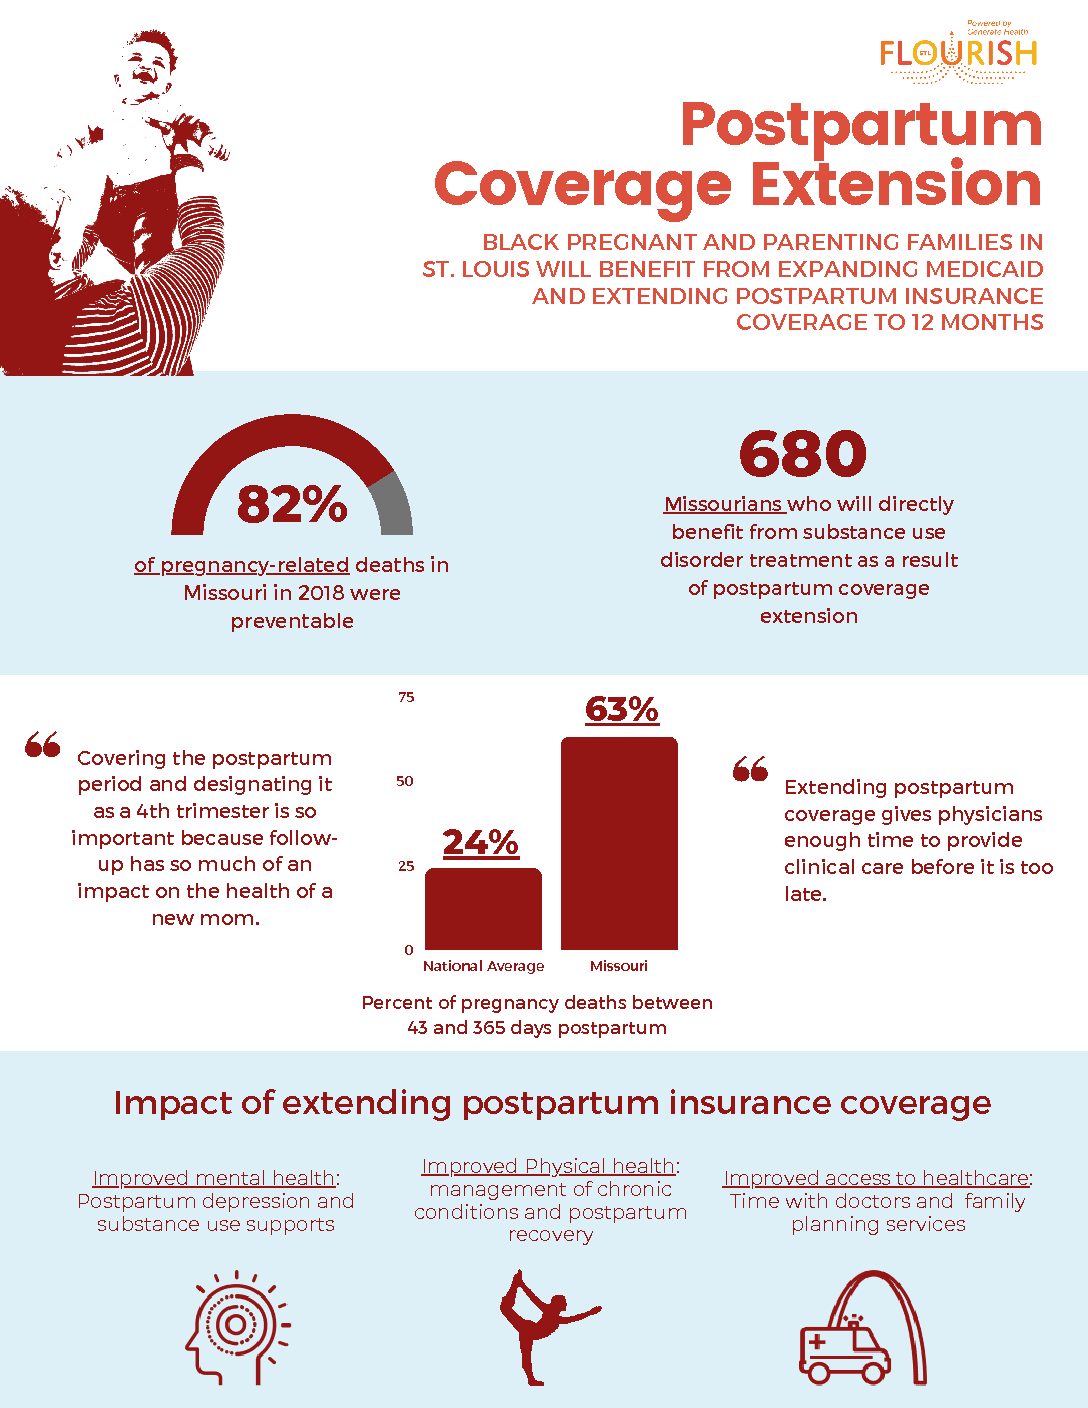
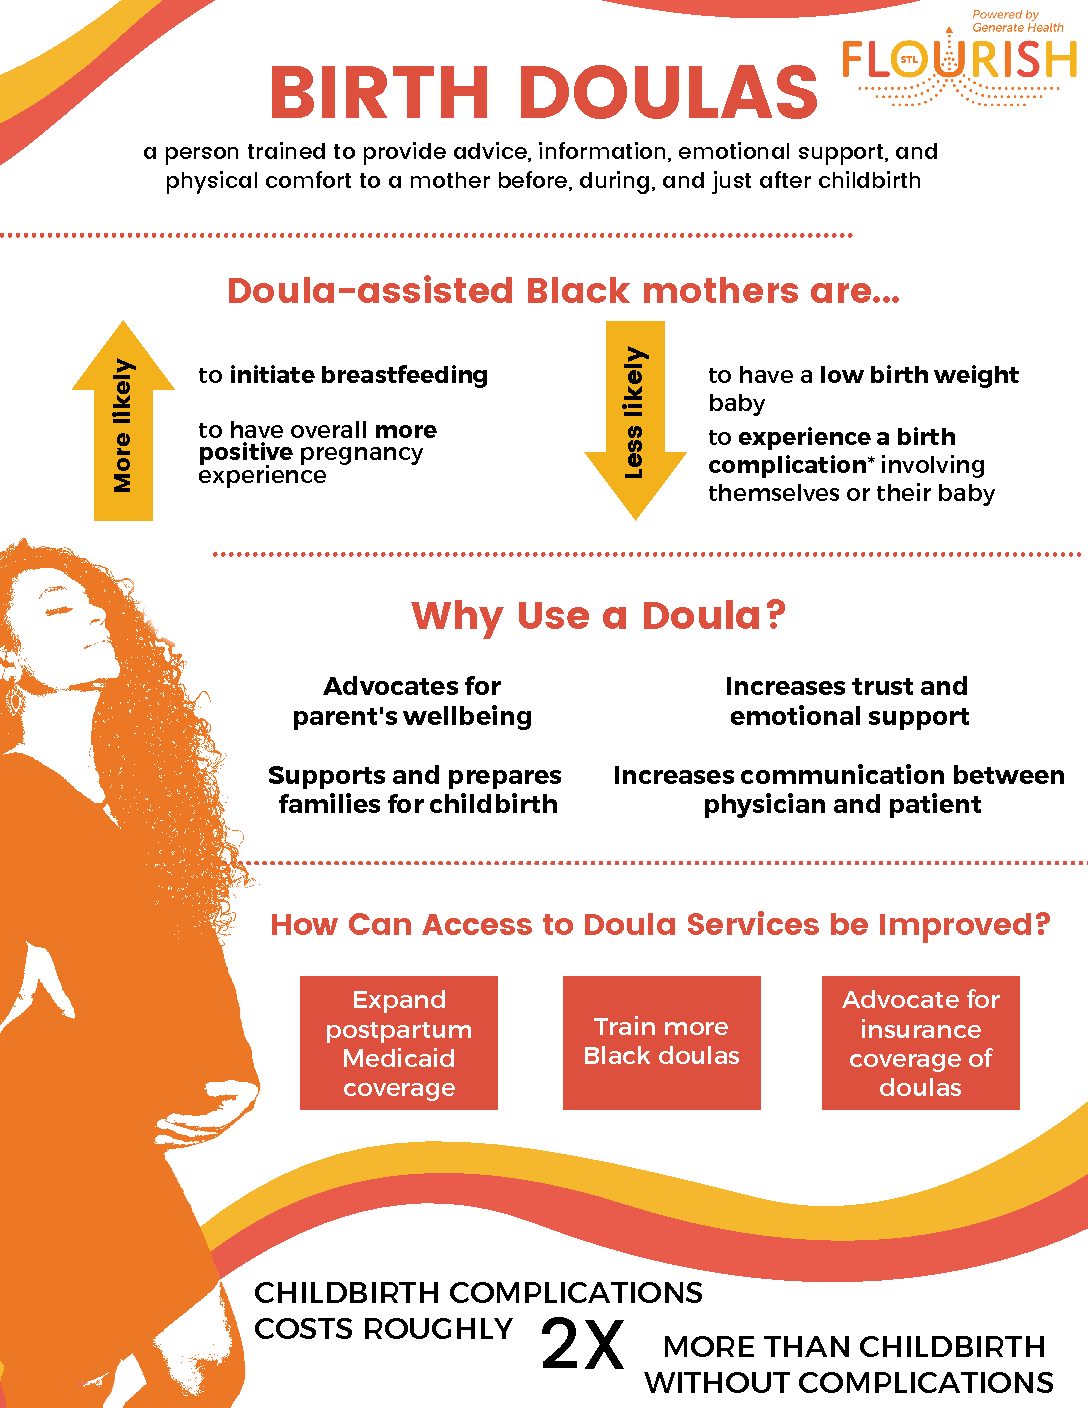
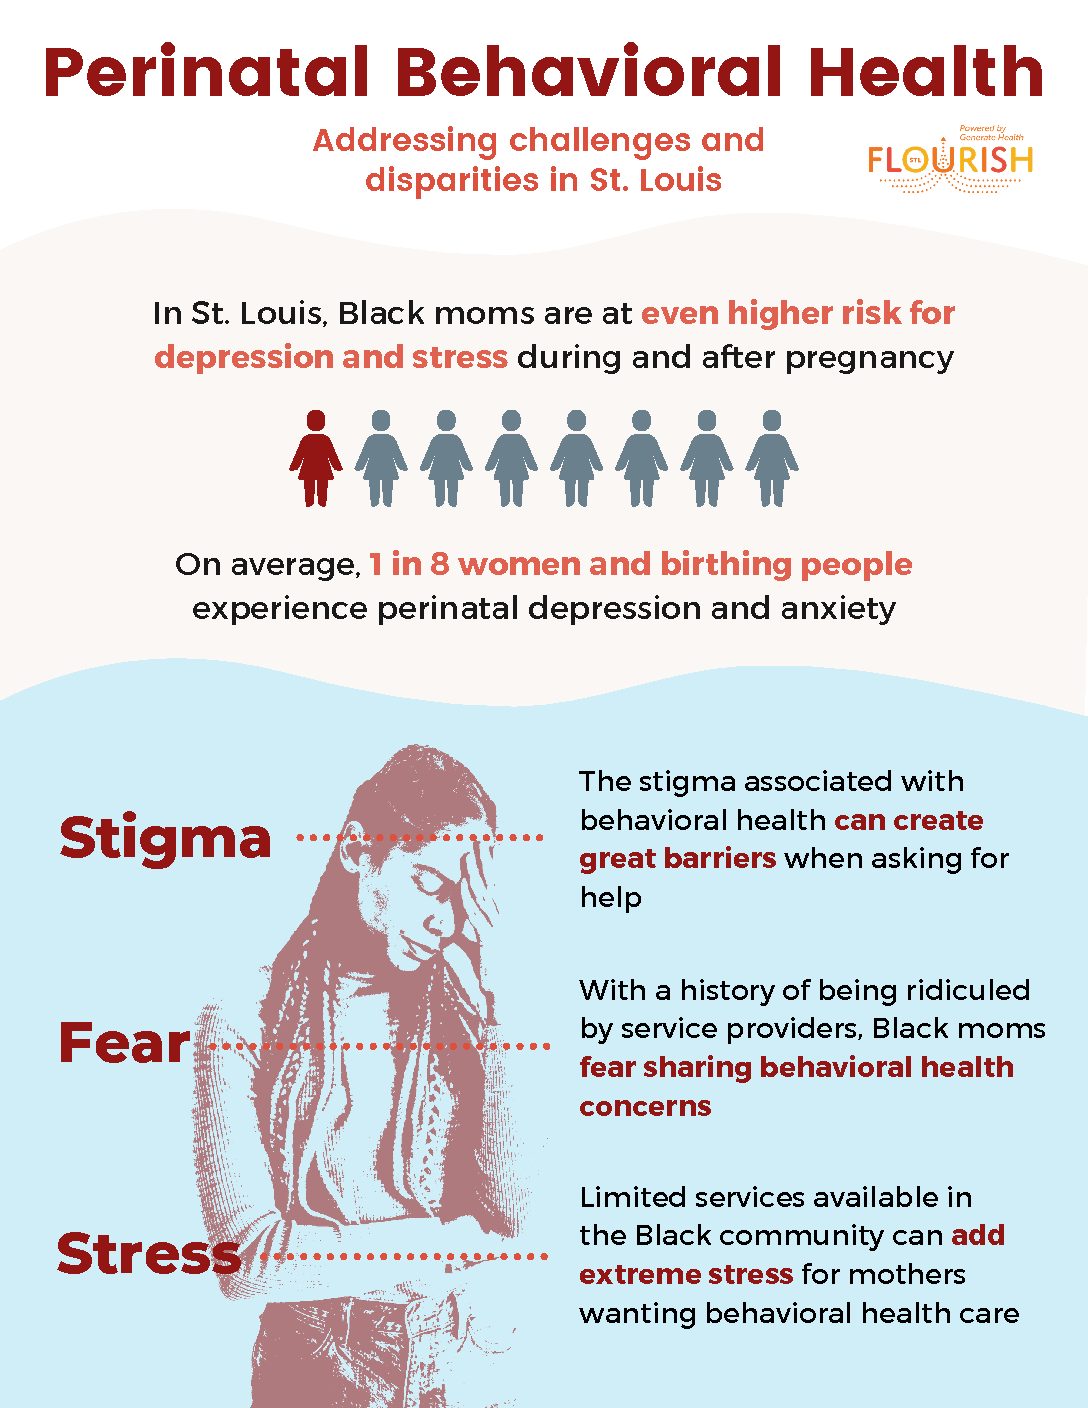
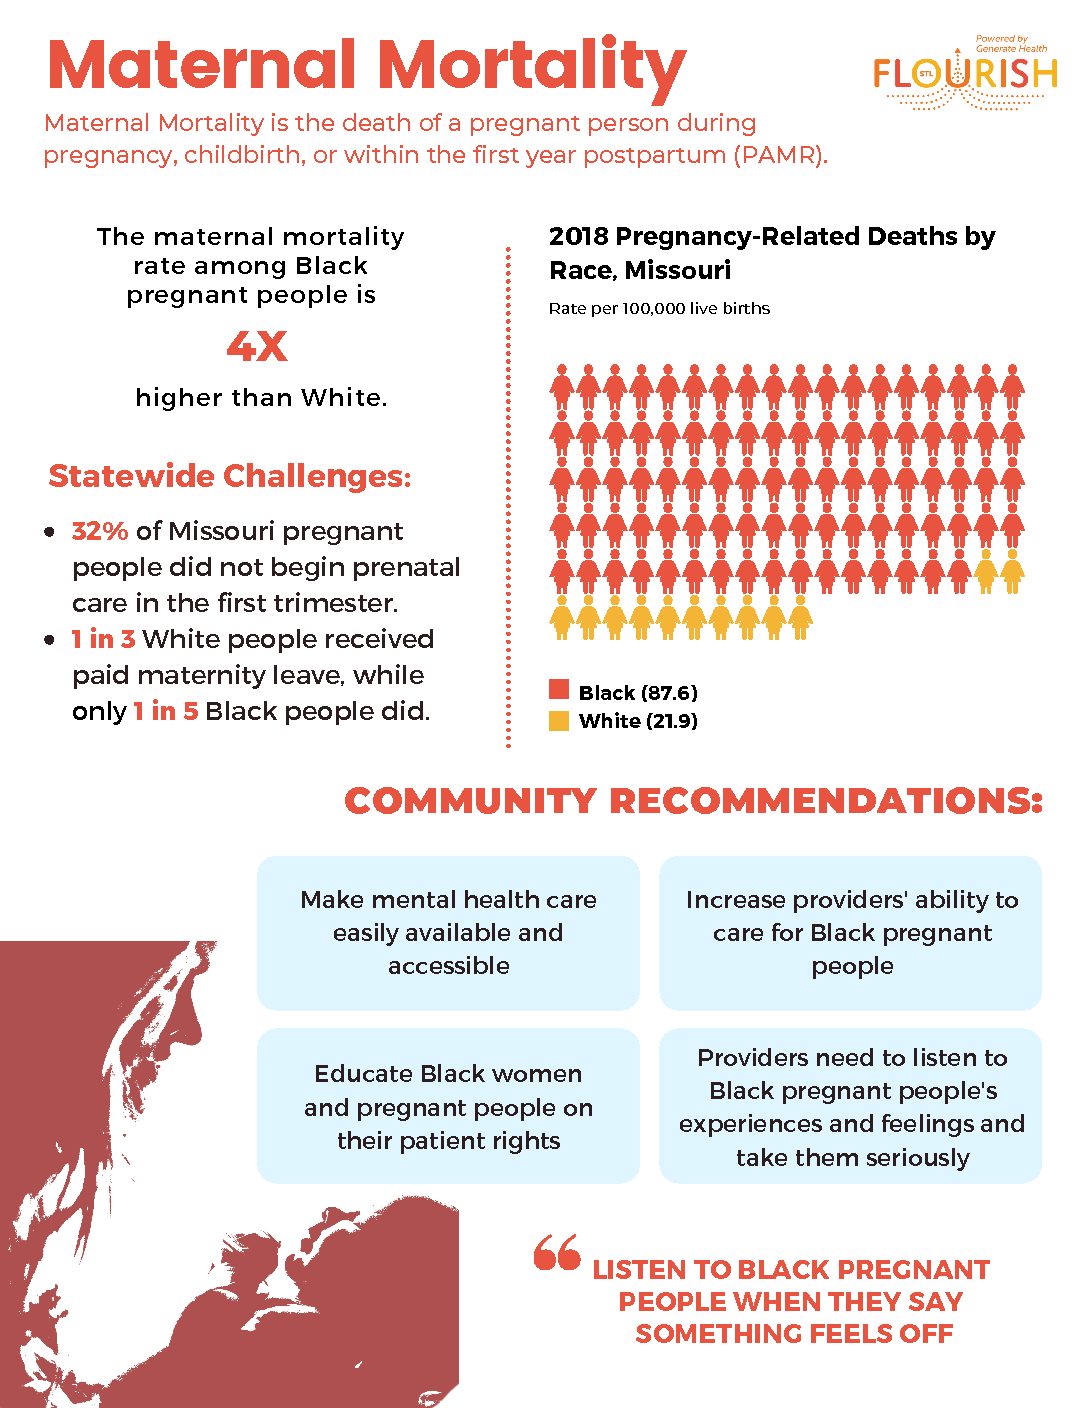
Extending health insurance coverage from 60 days to 1 year postpartum improves the health of mom and baby. It gives new mothers extra time during the postpartum period to receive healthcare for any pregnancy complications or behavioral health problems. Many cases of pregnancy-related maternal mortality occur between 42 days and 1 year postpartum. For example, while hemorrhage is more likely immediately following birth, heart complications and deaths related to mental health/substance use disorder more likely in the late postpartum period.
Click Red Button to View Infographic
Double-Click Red Button to Download Infographic
Pregnancy-Related Mortality Ratio
The pregnancy-related mortality rate is defined as an estimate of the number of pregnancy-related deaths for every 100,000 live births. (Source: PAMR Annual Report, CDC Pregnancy Mortality Surveillance System)
33
17.35
Preventable Pregnancy Deaths
Preventable pregnancy deaths is defined as the percentage of pregnancy-related maternal deaths that were preventable. (Source: PAMR Annual Report; CDC Pregnancy-Related Deaths Data Brief)
XX
82.0
65.8
Pregnancy-Related Mortality in Late Postpartum Period
Pregnancy-related mortality in late postpartum period is the percentage of pregnancy-related maternal deaths that occurred in the late postpartum period, between 43 days and 1 year postpartum. (Source: PAMR Annual Report, CDC Pregnancy-Related Deaths Data Brief)
XX
63.0
23.6
Pregnancy-Related Deaths- Substance Use Disorder
Pregnancy-related deaths- substance use disorder is defined as the percentage of deaths of a woman during or within one year of pregnancy that were due to use of illicit or prescription drugs. (Source: Missouri PAMR Annual Report; NIH Science Update)
X.X
54.0
11.4
Advocacy & Policy
Child Care Access
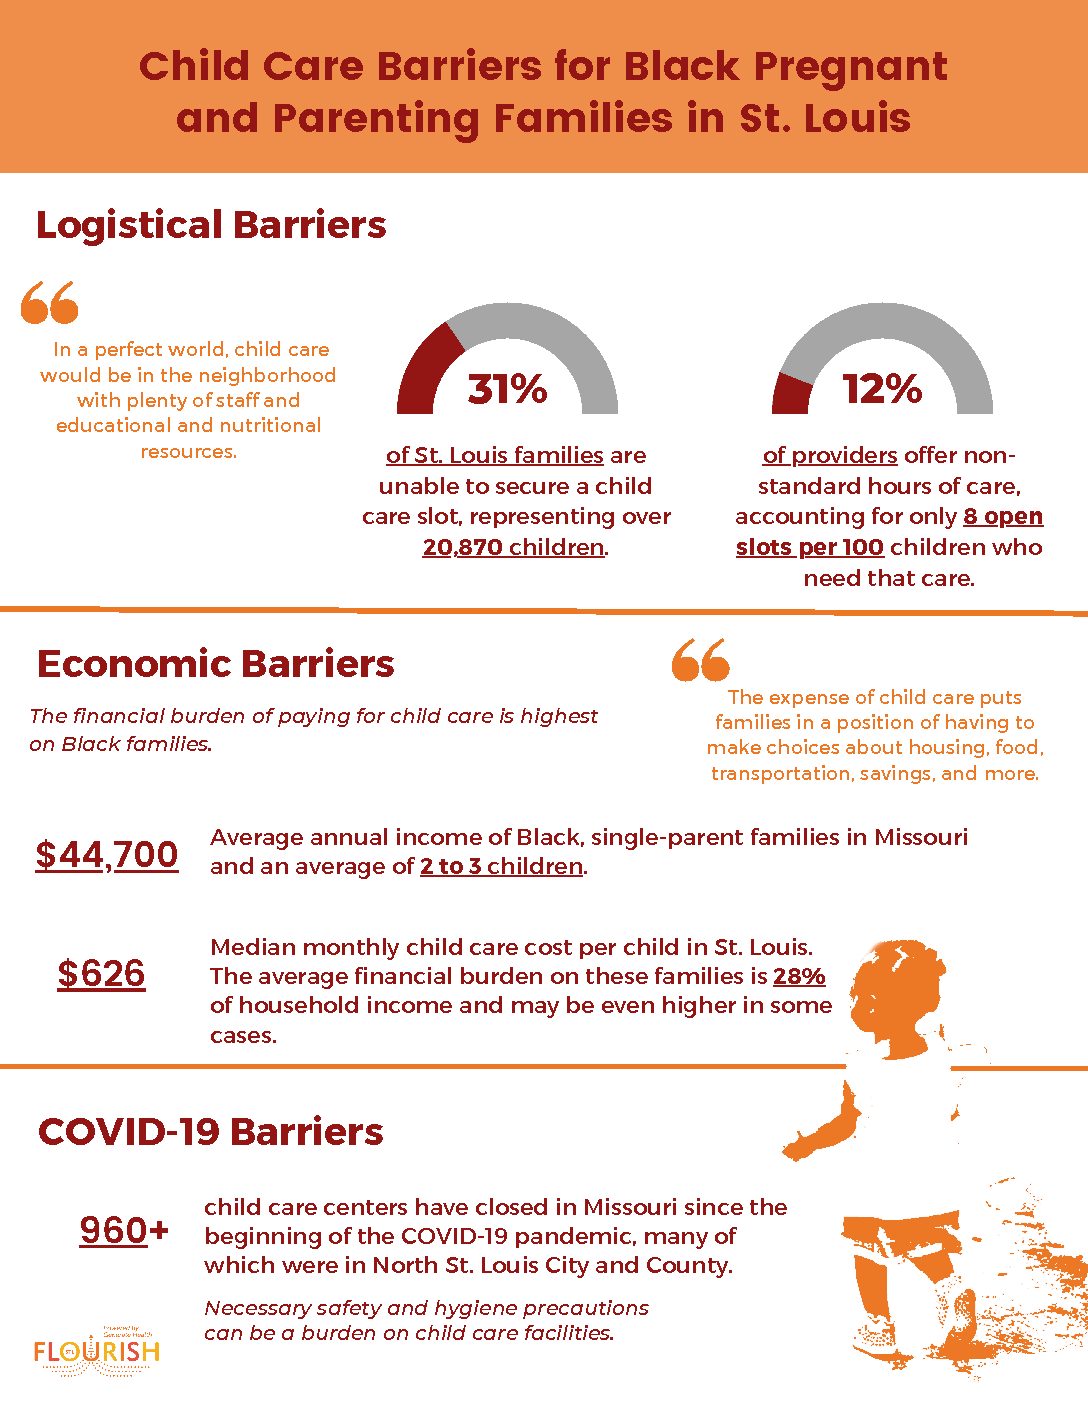
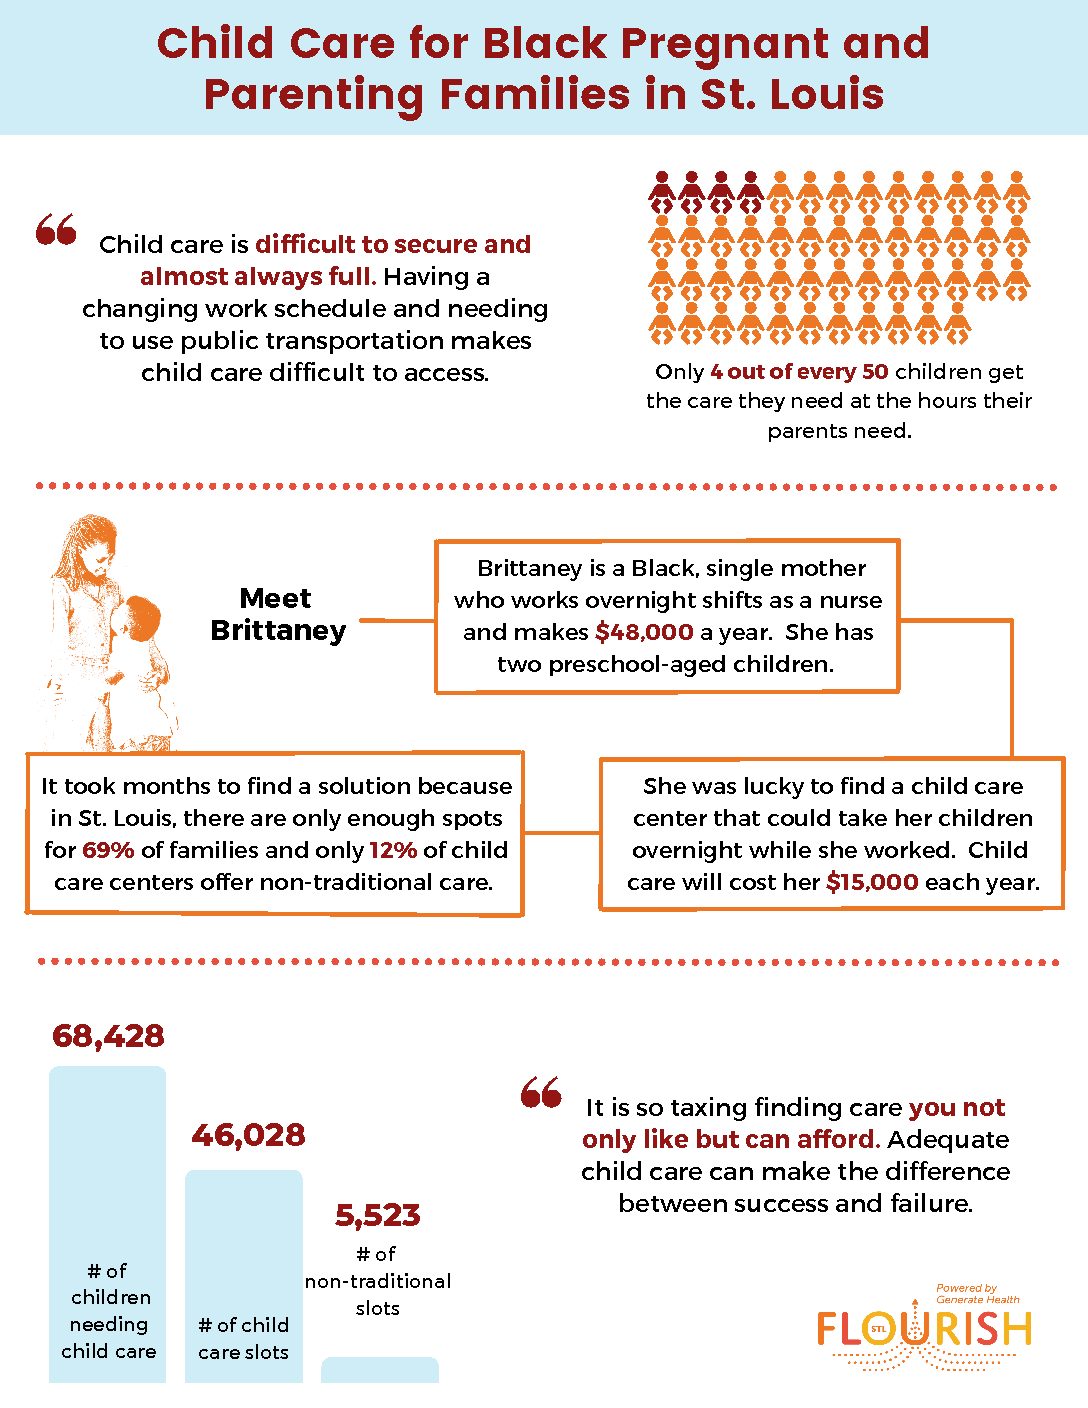
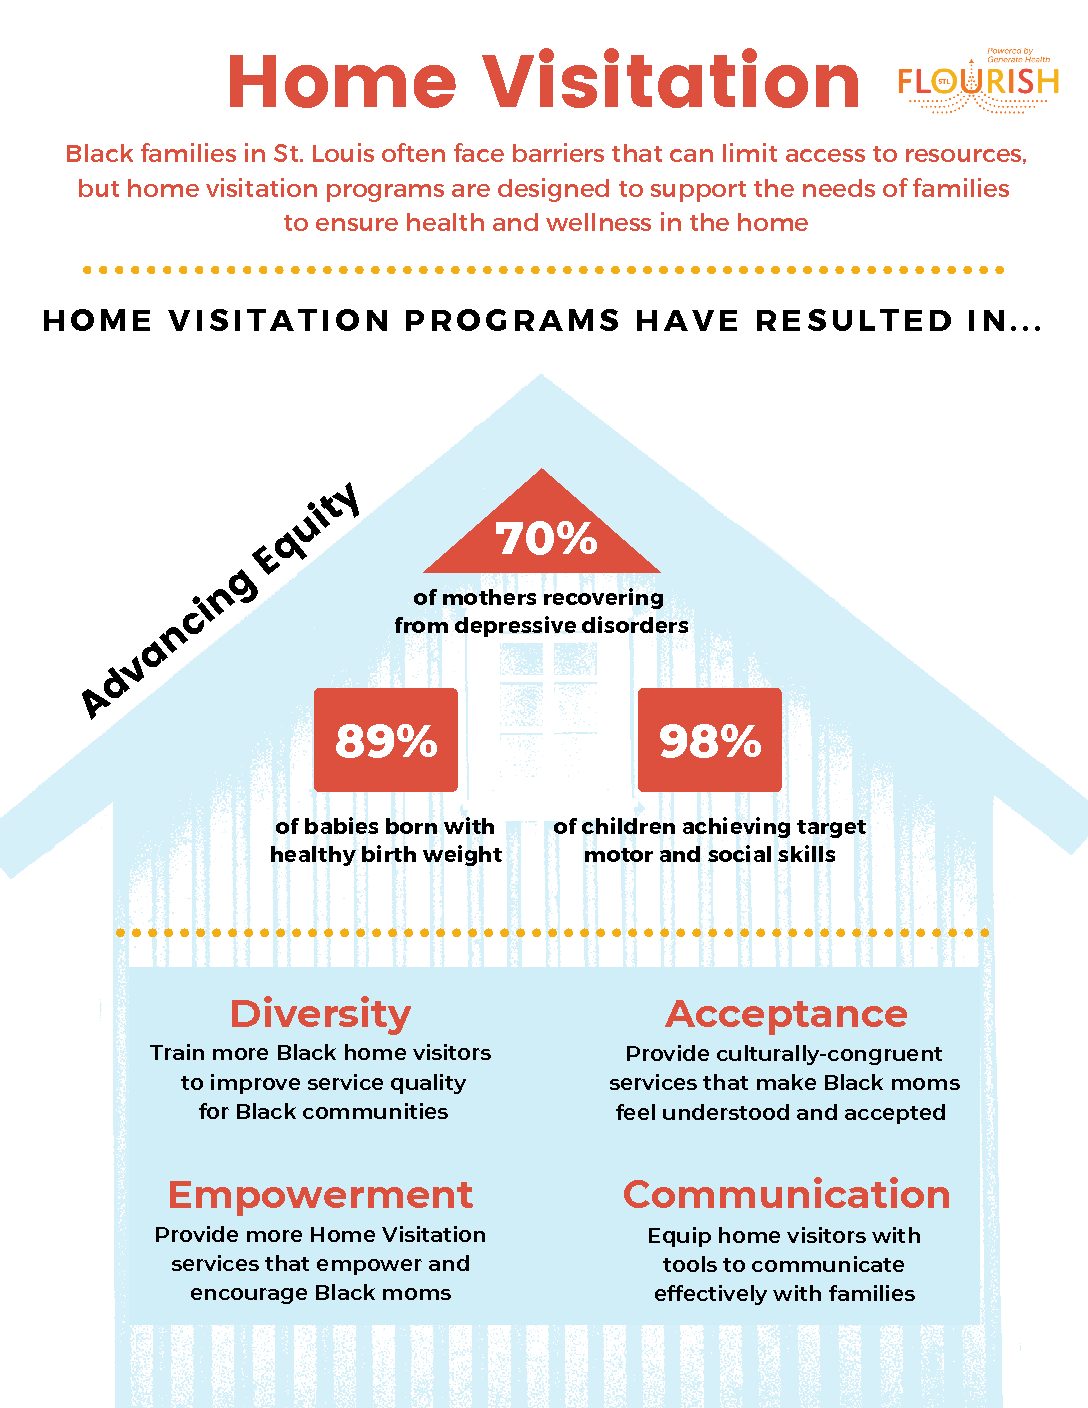
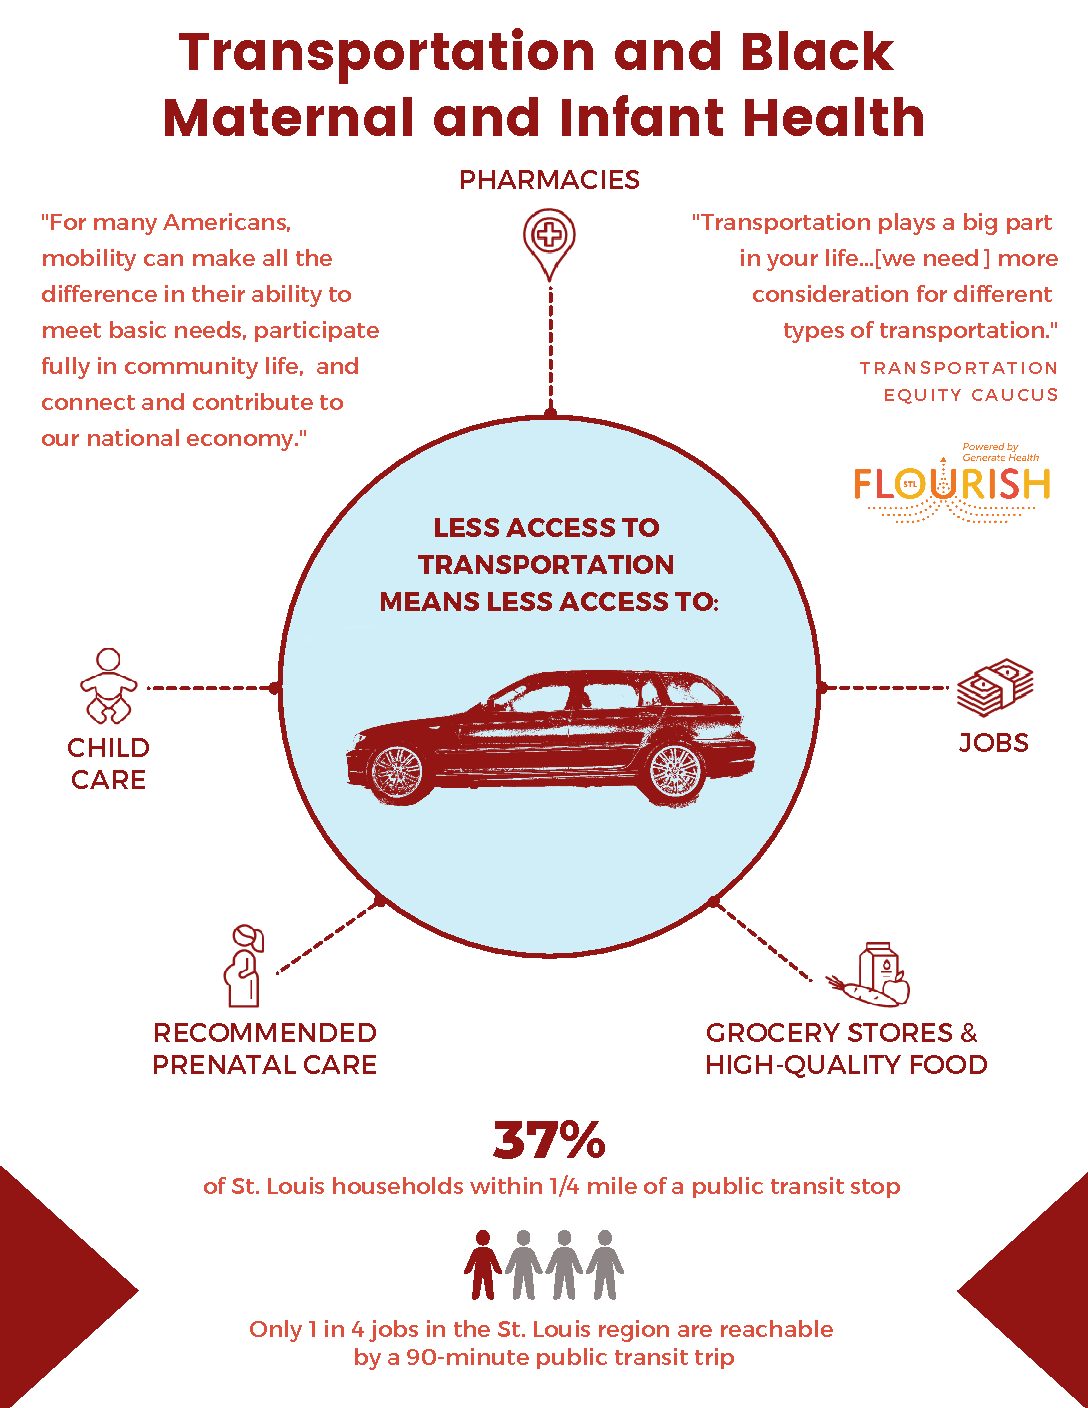
Having quality and affordable child care improves health for both children and their caregivers. Childcare gives families flexibility to attend doctor’s appointments and work. Childcare is important for a child’s social and emotional development and the mental wellbeing of caregivers. Without affordable child care, families must make choices about the quality of care and affordability of other needs like food, transportation and housing which can increase caregiver stress and diminish their mental wellbeing. Quality childcare supports the health and stability of families.
Click Red Buttons to View Infographic
Double-Click Red Buttons to Download Infographics
Child Care Affordability
Child care affordability is defined as the percentage of households where child care cost does not exceed 7% of a household’s income. (Source: Child Care Aware)
36.5
32.0
44.2
Child Care Accessibility
Child care accessibility is defined as the percentage of child care providers that offer non-standard hours of care such as between the hours of 6pm-6am and/or weekends. (Source: Child Care Aware)
15.8
9.0
X.X
Households With Children In Which Parents Work
Households with children in which parents work is defined as the percentage of children under age 6 with all available parents in the labor force. (Source: Kids Count Data Center)
72.0
71.0
68.0
Average Child Care Cost
The average child care cost is defined as the average yearly cost of child care. Note that the average cost of care varies by type of care provided (i.e. licensed child care facility vs. in home or family care provider) and that costs vary by age of child. (Source: Child Care Aware)
$7,508
$6,641
$9,167
Child Care Supply
Child care supply is defined as the percentage of child care slots per 100 infants, toddlers or preschoolers. (Source: Child Care Aware)
60
68
XX
Policy & Advocacy
Paid Family Leave
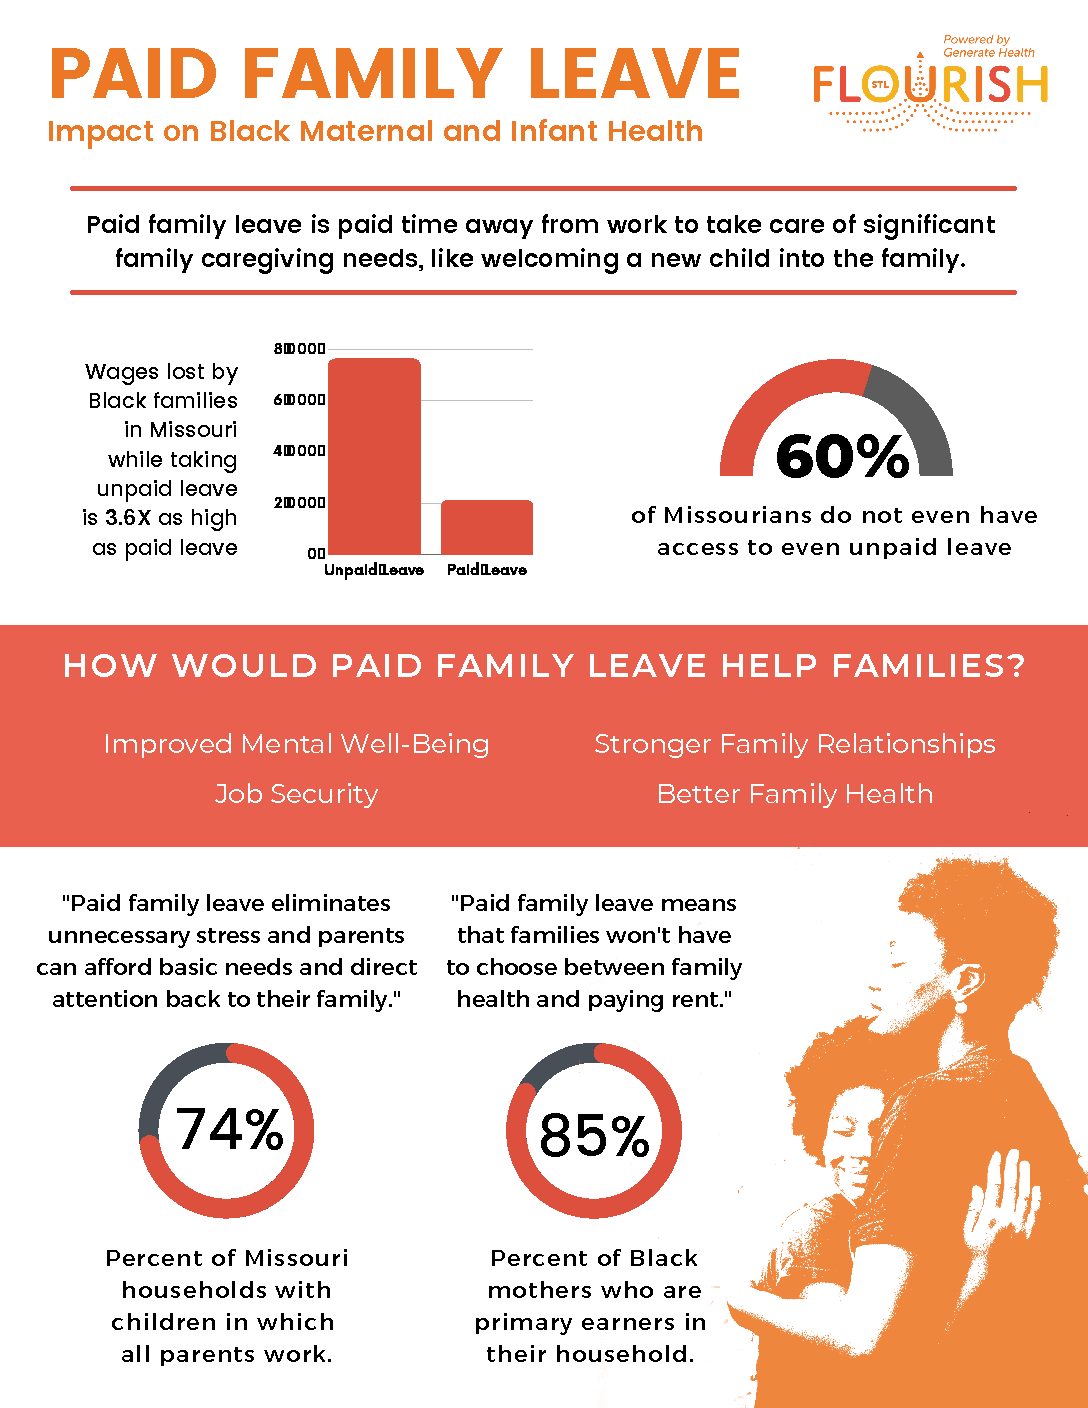
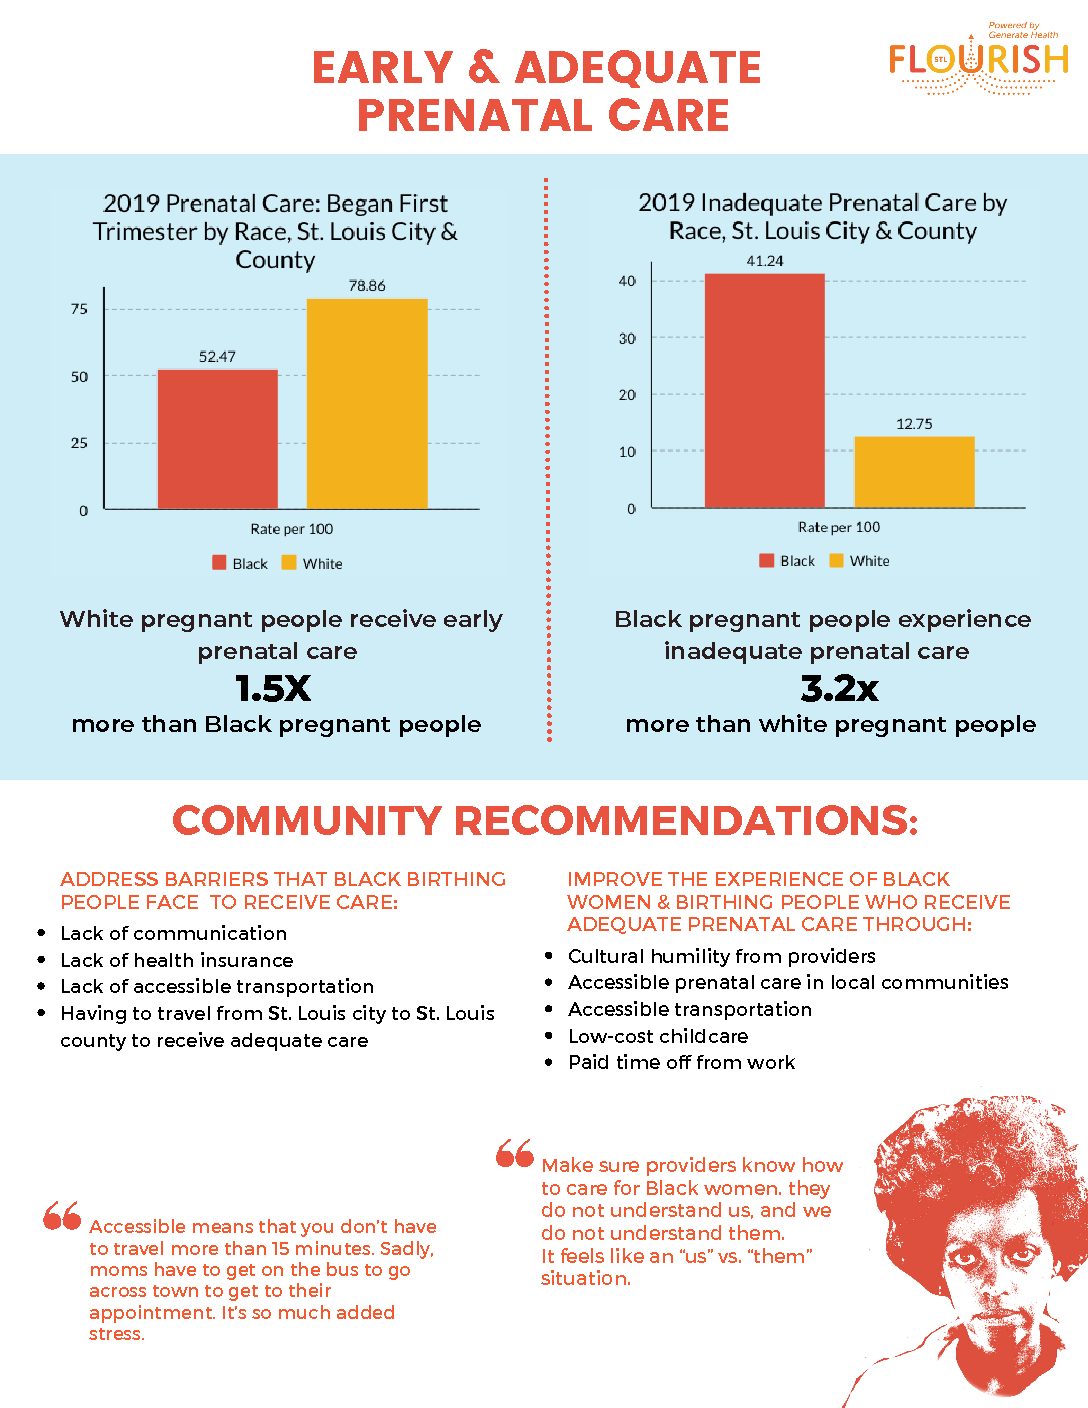
Paid family leave is essential for improving health, financial well-being and family bonds. Paid family leave refers to the ability to take paid time off work to care for a family member and is especially important when welcoming a new child into the world. Implementing paid family leave allows for improved mental health and more time to bond with a new baby, as well as increased breastfeeding rates, improving a baby’s physical health. Lastly, paid family leave results in happier and well-adjusted employees, as they can return to work when they are ready.
Click Red Button to View Infographic
Double-Click Red Button to Download Infographic
Access to Paid Family Leave
Access to paid family leave is defined as the percentage of workers had access to paid family leave. (Source: Bureau of Labor Statistics Paid Family Leave Fact Sheet)
X.X
X.X
23.0
Unpaid Family Leave
Unpaid family leave is defined as the percentage of working parents who are estimated to be eligible for and may be able to afford to take Family and Medical Leave Act (FMLA) unpaid leave (Source: Diversity Data Kids)
X.X
43.5
39.5
Wages Lost During Paid Parental Leave
Wages lost during paid parental leave is defined as the estimated wages lost for a full-time working adult ages 21-64 after taking 12 weeks of partially paid (FAMILY Act) family or medial leave. (Source: Diversity Data Kids)
XX
$2,640
$2,644
Wages Lost During Unpaid Parental Leave
Wages lost during unpaid parental leave is defined as the estimated wages lost for a full-time working adult ages 21-64 after taking 12 weeks of unpaid family or medical leave. (Source: Diversity Data Kids)
XX
$9,395
$9,578

